I call B.S. on Stihl. My dyno doesn't lie. MS 461 is king over MS 660

Arborist Forum

Help Support Arborist Forum:

This site may earn a commission from merchant affiliate links, including eBay, Amazon, and others.
Are you talking about the flock or the mesh filters. I can see the mesh filters letting in all kinds of dust, but that's what my 346 has been wearing for 10 years.
I'm talking flock and pretty sure MCW is too.
His situation would be worse than mine, he lives in 10-15" rainfall country, I live in 35-40" rainfall. What he calls dust is bloody great clouds of red sand.
 
I'd like to figure my percentage in loss from the drag of the dyno parts and ad that percentage to all my #'s.

You'll do well if you achieve this accurately, the rolling road type dynos have a mode where you slip the car into neutral and as the car coasts down it calculates losses in the drivetrain. There is some fairly sophisticated computing behind calculating these losses and this is a huge part of the variation between different dynos. In the end all tuning work is carried out on raw data, with the correction for losses just used to give the customer a pretty graph that has a higher number to make them feel better about themselves.
 
You'll do well if you achieve this accurately, the rolling road type dynos have a mode where you slip the car into neutral and as the car coasts down it calculates losses in the drivetrain. There is some fairly sophisticated computing behind calculating these losses and this is a huge part of the variation between different dynos. In the end all tuning work is carried out on raw data, with the correction for losses just used to give the customer a pretty graph that has a higher number to make them feel better about themselves.
Right on. We shouldn't be too concerned at this point if Chad's dyno says a 660 makes 3 hp or 30 hp. We want it to tell us if a 660 makes more hp than a 461, or if a muffler mod is worth real power or just acoustic gains. We want to know if a particular set of timing numbers makes more usable power or a peaky G2G toy. All of which his dyno already will do.
 
I found a program to graph it on. I want to retest the saws at higher than 10,000 rpms to give the ported 361 credit for its high rpm torque. I'd like to figure my percentage in loss from the drag of the dyno parts and ad that percentage to all my #'s.
Wouldn't a simple spreadsheet be the easiest? LibreOffice works great and is free, but if you must pay for inferior software you could use MS Execl.
 
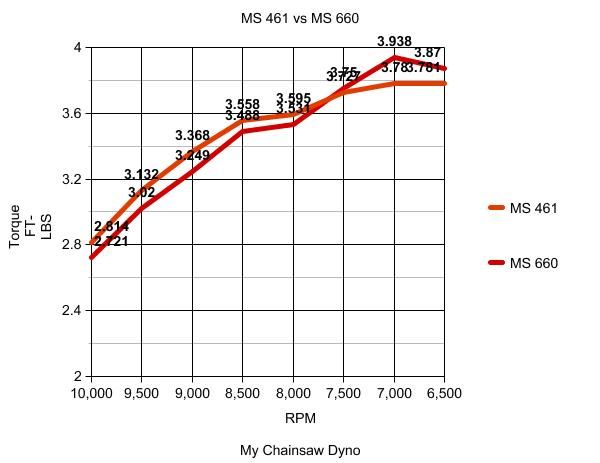
Here's a line graph from the first test. This is torque not
hp
graph_zps9e2abfd8.jpg
 
Funny how it all seems so much clearer in a graph.
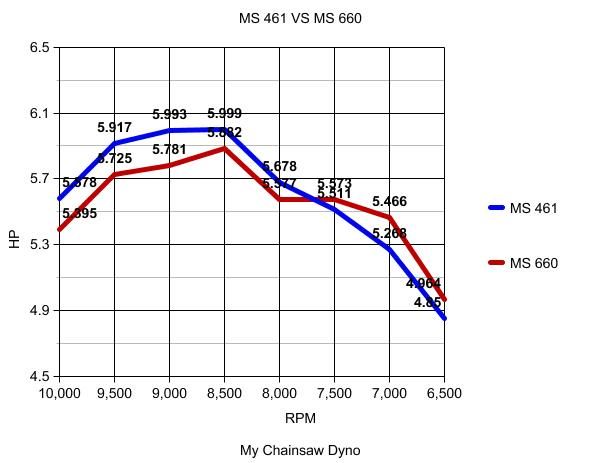
The nice smooth curve of the 461 is the classic shape of a healthy motor that is working well.
The jumpy shape of the 660 curve is the classic shape of a motor with issues, at least when there aren't devices to change inlet or exhaust timing.
Just looking at the graphs you would expect the 660 to pick up power by going through the ignition timing, fuelling and exhaust, but wouldn't be surprised if compression ratio or port timing needed help. Now we know from what respected builders have said that in this case there are problems in the port timing, but I wouldn't be surprised if the shape of that graph cleaned up with exhaust and ignition timing mods, perhaps a decrease in squish. But I'm sure it won't see a significant increase in peak torque and power until it's ported.
Graphing gives another benefit - when calculating the work capacity of an engine it is often better to look at area under the graph, rather than peak numbers. In the case of a chainsaw you would just cut off the graph at the edges of likely rpm in the cut, and measure everything below that. That is a graphical way that shoes how "torquey" motors often beat "peaky" motors.
 
You can also see how the 461 is going to fall on it's face if the rpm in the cut drops much below 8500, but the 660 may just keep pulling down to 7000 - assuming the operator doesn't lift of course.
 
Did you move to Japan? We read left to right in the Western hemi ;)

Nice graphs, though. Graphics really help with visualizing the differences.
Yeah I didn't like the look of the rpms low to high but I'll do it the right way. I also like the second graph better as the line colors are easy to see. This is the only way I'm going to display dyno results from now on. I'm going to make a new graph with 660, 461, and the ported 361 with higher rpm readings included. There's quite a bit work that goes into testing a saw to making a graph. Lots of notes and calculations involved. I check it over twice to make sure I didn't mess up the #'s. I wish I could find a program that I could simply input my dyno #'s and the program would do all the calculations for the graph.
 

Latest posts

Back
Top